Statistical Structure of Random Event Sequences
Papers
Predicting Outcomes of Random Phenomena
Ranking Events Based on a Random Sample
Abstract
This project began by asking how observed data should be used to predict the next outcome of a random process. We compared fixed, adaptive, memory-based, and randomized prediction strategies for categorical and real-valued outcomes under several loss functions. That work led to a related question: because effective prediction often depends on identifying which outcomes are more likely, how much data is needed before a ranking based on observed frequencies can be trusted? We then developed exact and simulation-based methods for determining the probability of a correct ranking and the sample size required to reach a desired level of confidence.
Predicting the next outcome
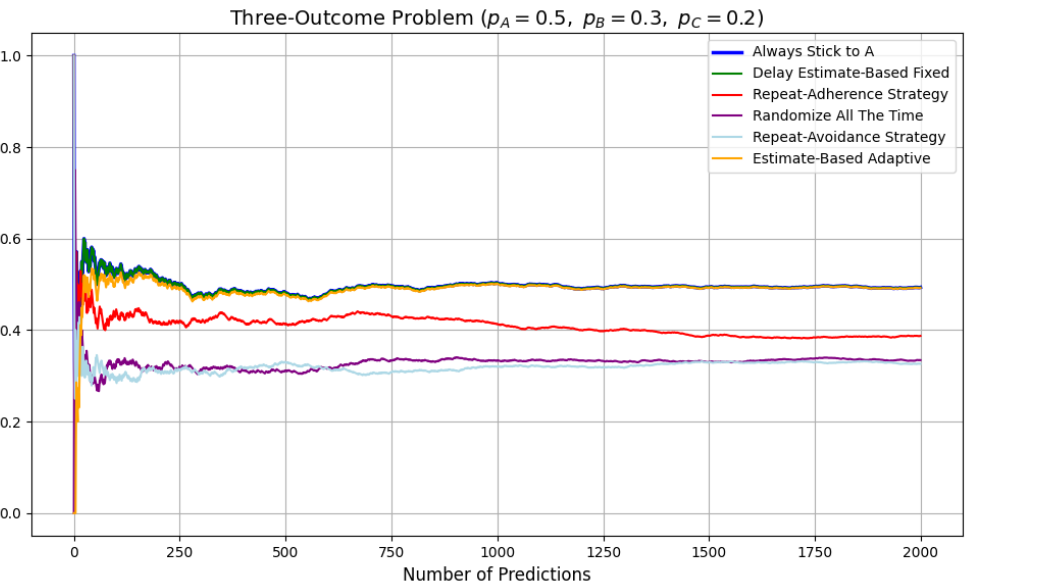
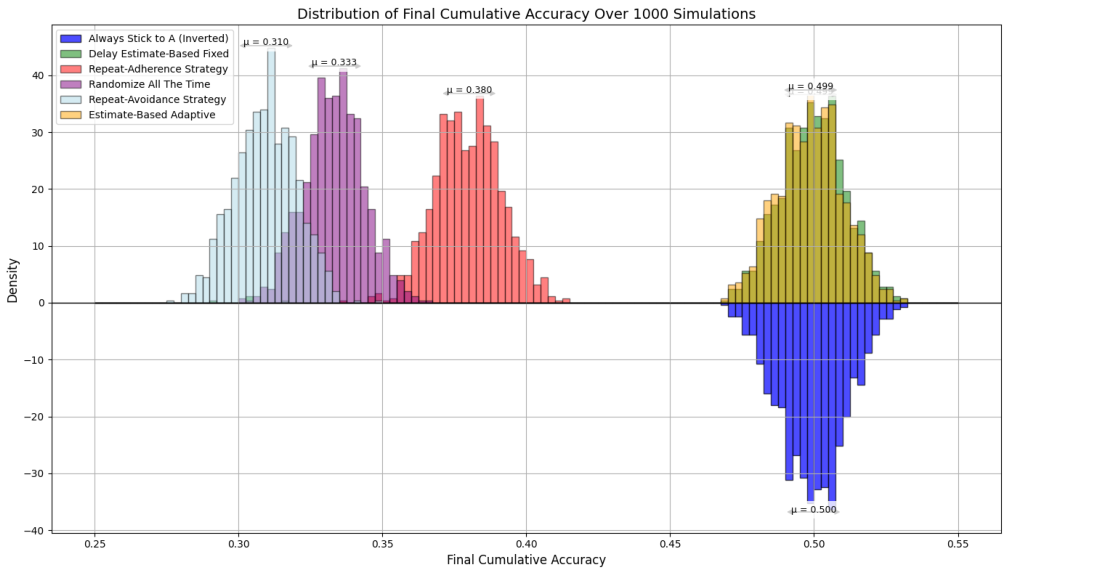
We first compared strategies that always make one prediction, estimate probabilities after an initial sample, update estimates continuously, repeat or avoid the latest outcome, or randomize. In the three-outcome experiment with probabilities ((0.5, 0.3, 0.2)), the estimate-based strategies converge to an accuracy near 0.50, while repeat adherence reaches about 0.38, uniform randomization reaches about 0.33, and repeat avoidance reaches about 0.31. The prediction results show that a useful rule should depend on both the observed data and the cost assigned to different errors. Across the settings we studied, adding unrelated randomness did not improve prediction performance.
Ranking events from a finite sample
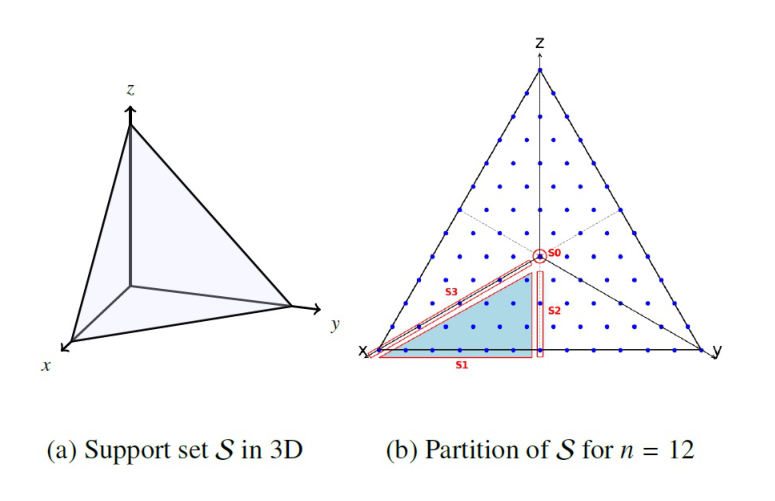
Observed frequencies are natural estimates of unknown event probabilities, but small samples can produce ties or reverse the true order. For three outcomes, the possible frequency triples form a triangular lattice. Partitioning this support by the six possible orderings—and accounting for ties—allows us to compute the exact probability that sorting the observed frequencies produces the correct ranking.
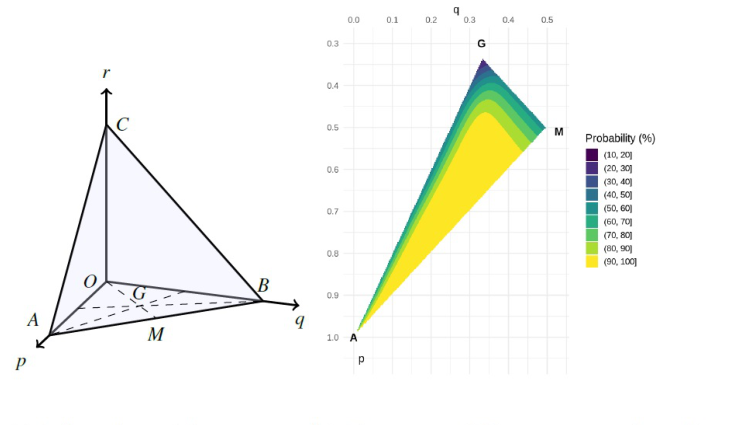
The same calculation reveals how ranking confidence changes across the parameter space. When the true probabilities are ((0.37, 0.33, 0.30)), at least 2,210 observations are needed to reach a 95% probability of recovering the complete ordering. The required sample grows quickly when the probabilities become closer because the categories are harder to distinguish.